With effect from Version 14.2 of Questetra BPM Suite, it is possible to run debug Cases on individual Auto-Processing Tasks in the middle of a Workflow App. This enables App developers to test the functionality of a single Step in an App without having to go through the entire workflow.
[Added on 2023-08-18] On and after Version 15.1, debug execution is now possible also on Split Gateways.
Debug Only This Node
Similar to the method of debugging described in this page, you must open the Settings window for the Step you wish to debug in the App Modeler. Below the [Note] section is a button labelled [Debug only this node] with a bug icon.
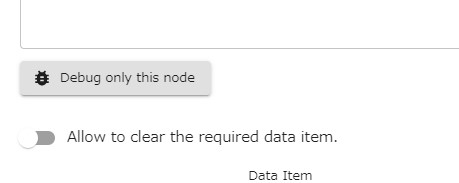
Clicking the [Debug only this node] button will open the Debug Case Execution window, from which the debug C can be initiated by clicking the [Start Case] button.
Unlike starting a debug Case from a Start Event, in which the debug Task will flow through the entire workflow, when it is started from an Auto-Processing Step a dummy workflow App is created, consisting of a Start Event, a Human Task (which the user will operate from the [My Tasks] list), the Auto-Processing Step which is the target of the debug Case, and an End Event.

The [Debug only this node] option is available for all Auto-Processing Tasks, including all grey Tasks listed on R2010: List of Modeling Elements, Tasks listed in Add-on Auto-Steps which can be added to the workflow platform manually, your self-made Add-ons, [Throwing Message Intermediate Event (email)], and [Throwing Message Intermediate Event (HTTP)].
Also for [XOR Gateway] and [OR Gateway] on and after version 15.1.
In The Task Lists
Debug Cases can be easily identified on lists such as [My Tasks] or [Operated Tasks], etc. by looking for the bug icon prefix in the title column.

It is also possible to filter debug Cases by clicking on the filter list icon filter_list, then click the Add Condition button and select [bug_report Debug Case] from the menu. The list of filter conditions will then show radio buttons allowing you to select whether to display only debug Cases, or to exclude debug Cases from the list of Tasks.

Debug Cases are excluded from aggregation in the [Heatmap], [Dashboard], [Your performance], and [Organizational performance]; and when creating a new chart in the [Chart] menu, the filter condition [except debug Cases] is now specified by default.
Debug Results
The Auto-steps that can be debugged using this method have a great variety of functions, so please be aware that the results of debugging will vary depending on the function of the Step. In many cases the results will not necessarily be visible in Questetra, but may take effect in an external cloud service.
For example, when debugging the item [Google Drive: Upload File], it will be necessary to check your Google Drive account to confirm that the debug Case has been successful, as this is where the effects of the Auto-step are visible.
To view the effects of debugging in Questetra you can view the [Operation History] in the [Case Details] Screen, and with [Administrator Mode] you can view the Case Log. Alternatively, many Auto-processing Steps have the option to store logs in a Data Item, so by selecting an appropriate Data Item in the log field within the settings window of the Step you can retain details about the Step’s operation during debugging.
Debug on Split Gateways
From Version 15.1 (August 2023), [Debug only this node] is now possible for [XOR Gateway] and [OR Gateway]. This allows you to check only the transition results according to the set Splitting conditions.
The method of execution is the same as in the case of the automatic step, so you enter the data in [Human Task] and finish it. The Debug Case is finished, and you can check the transition result in the flow diagram at the bottom of the Case Details. The transition destination candidate steps are displayed as [End event] with their step names. Transition results can be seen in red arrow paths and gray circles representing tokens.