Development Checklist
There are various checks you must do to ensure that an App you have designed is ready for deployment and will operate in the way you require. Some faults in the App design will generate flags to notify you of their presence, but others may not so you must be careful that all the settings are configured appropriately. The main following things that should be checked are as follows.
- Check that all nodes are connected in sequence between a Start Event and an End Event.
- Any node that is not connected in this way will display an exclamation mark alert warning either that the Token will never reach the node, or that the node never reaches an End Event.
- Check that all necessary configurations with each node have been set.
- If a required field within an icon is empty an alert symbol will appear on the icon indicating that the settings are incomplete.
- Ensure that expressions and API connectivity settings do not contain any typos so that the App is functional upon release.
- Check that all the Data Items have their Field Names set appropriately.
- Field Names are blank by default so you must set these manually for each Data Item.
- Until the Field Name is set an exclamation mark icon will be displayed on the Data Item tab and the Data Item itself indicating that the Field Name is required.
- All Field Names must have the prefix “q_” followed only by alphanumeric characters and underscores.
- Field Name must be unique. Field Names of duplicated Data Items will cause an error.
- Check the Swimlane operators are set correctly
- When a Swimlane is created only the App creator will be named as the default operator. In order to ensure Tasks within the Swimlane are allocated to the appropriate parties you must configure the Operator section to specify those who will be in charge of the Tasks.
- Check Split conditions are set correctly
- If the User will select the direction of the flow then the buttons must be labelled appropriately.
- If the conditions will determine the direction of the flow you must make sure the transition condition has been set correctly.
- Check the Description sections of each Data Item
- Setting up HTML tags or JavaScript in the Description can enhance business efficiency.
What is Debug Execution?
Debug execution is a function that allows you to check how an App operates during the App’s development and before it is released. This allows the App designer to see what the Users will see, and to confirm that the App behaves as expected prior to being used in production.

How to Run
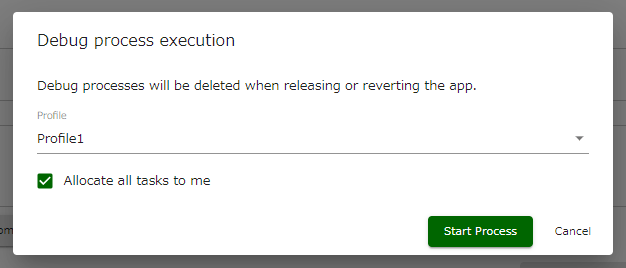
Open the edit mode of the App modeller and select a Start Event or an Auto-Processing Task. If you open the properties window of the Step you will see a button with a bug icon beneath the Note section labelled either “Start debug process” (for Start Events) or “Debug only this node” (for Auto-Processing Tasks). Clicking this button will allow you to select the Profile that will be used for the debug Process. Click the “Start Process” button to begin.
After clicking Start Process you will be given the option to immediately open with the Detail page of the starting Task. As with a regular Task you will be able to operate the Task, input to available Data Items and save the data. Once you hit the Finish button the Process will move to the next Step and continue along the flow until it reaches an end event, generating new debug Tasks at the appropriate points along the way.
Differences compared with normal operation
Debug Processes behave in the same way as normal processes. However, they differ from normal processes in the following ways:
- In lists such as [My Tasks], a bug icon will be added to the title
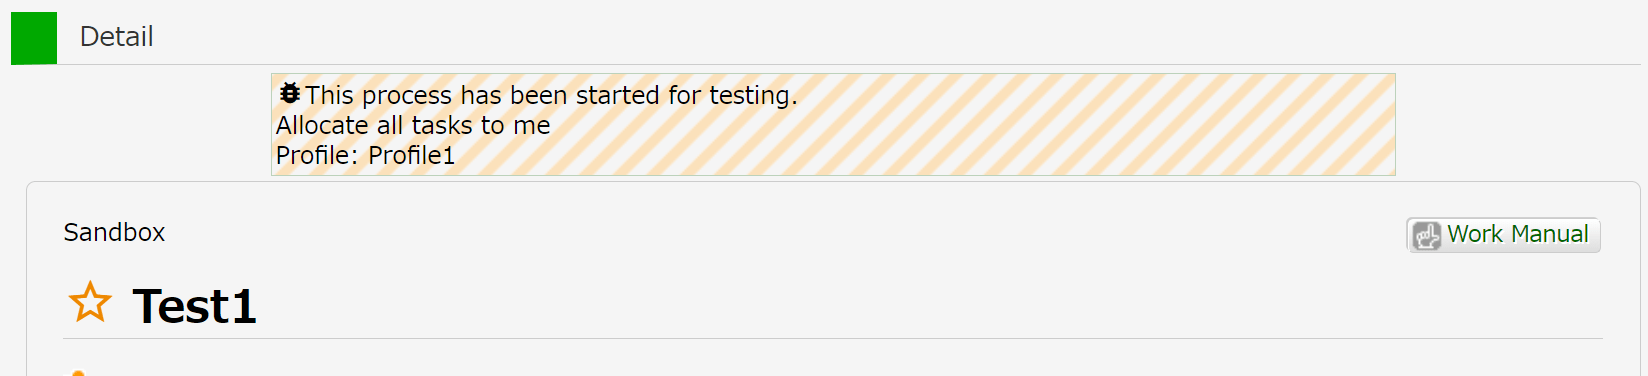
- A warning will be displayed at the top of the process details screen indicating that it is a debug process
- The string “(Debug)” will be added to the subject line of notification emails
- The process sequence number will be fixed at 1 and will not be counted
- Child processes called from a debug process via HTTP communication will also become debug processes
- When an app is released, debug processes executed in that app will be automatically deleted
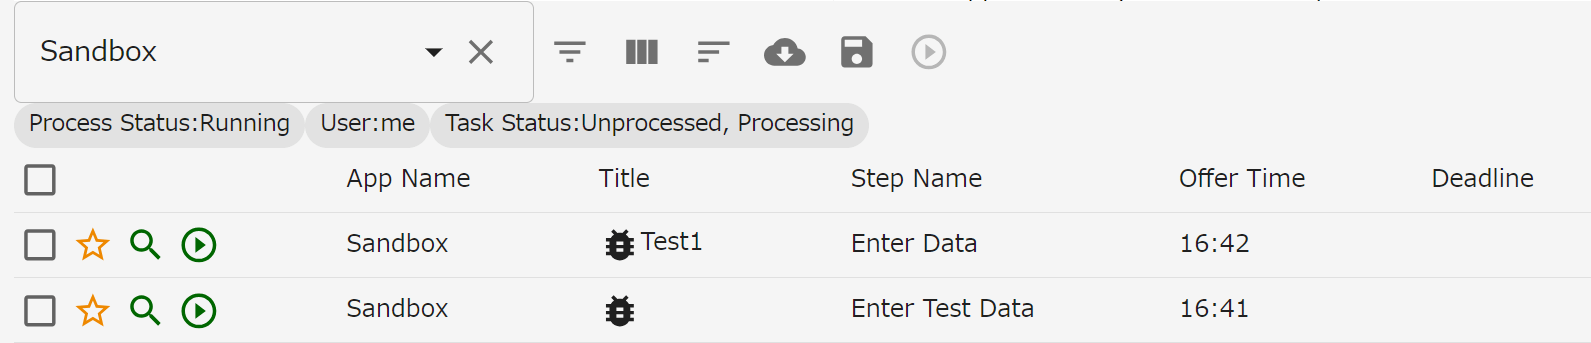
For more details on filtering debug tasks click here.
Options
- Profile
- Allows you to select between Profiles that have been set up in the App config Variables Settings.
- Profiles may have different attributes, such as email address, which allow you to vary how the Process operates depending on the chosen Profile.
- Allocate all Tasks to me
- When checked this will override the Swimlane operator settings so that all Tasks will be allocated to the User running the Debug process.
- If the Allocate all Tasks to me option is not selected Tasks will be given to operators according to the Swimlane settings.
- Notification emails will contain Debug in their subject
App config Variables Settings

App config Variables Settings can be accessed in the Edit mode and can be used to alter various fields in multiple Icons in your App all at once through the use of Profiles.

First you must create a Profile with a unique name by clicking the “+” button next to the dropdown menu. Then by clicking the “+” button further down the window where you can create variables will open.
- The variable name is just a label and can be anything you want, for example “Email Address”.
- The variable value is the content that will be input to the relevant field in the Icon, such as an actual email address.
To utilize the variable, selecting [Variables: (Variable Name)] on the dropdown of [Insert reference…] will insert the expression “${var[Variable Name]}” into the Icon field you want to use.

For example, if you have two Profiles called PROFILE1 and PROFILE2 and the variable Email Address, you can set the variable value as “steve@questetra.com” for PROFILE1, and “jane@questetra.com” for PROFILE2. In an App that contains a [Throwing Message Intermediate Event (email)] you can insert the variable ${var[Email Address]} into the To field. When performing a debug, if PROFILE1 is selected the [Throwing Message Intermediate Event (email)] will send an email automatically to steve@questetra.com, but when PROFILE2 is selected it will send an email to jane@questetra.com.
It is possible to have multiple variables so that when you switch between Profiles various different fields are affected, and variables can be used in any field that requires a written input. However, they cannot be used in fields that use dropdown menus or radio buttons.
Determining whether it is a Debug Execution Process
In Split-condition expressions and Scripts, it can be determined whether the running Process is a Debug Execution.
It is possible to define a workflow such as, for example, skipping an email sending step during debugging.
- Split-conditional expression in Gateways
- In the Split-conditional expression, specify processInstanceDebug == true in the SpEL expression
- If it is determined to be a debug process, processing proceeds to the specified transition destination
- Script Task
- Write if (processInstance.getProcessInstanceDebug() === true) { } in your script
- If it is determined to be a Debug Process, that block will be processed

Notes
- The Debug process will operate as if it were a live process, so a [Throwing Message Intermediate Event (email)] will send emails to any specified recipients, and API connections will also function as normal.
- Debug execution can be performed on Apps that have a manual Start Event or one of the following Timer Start Events: [Timer Start: Number of Choices], [Timer Start: Number of Organizations] or [Timer Start: kintone: Number of Records].
- Only one randomly determined Debug Process will be started, not multiple Processes
- Start Events will become active as soon as the App is released; so Timer Start Events will begin to generate Processes automatically at the appropriate time.
- For Apps that only have start events that do not feature a Debug function, such as [Message Start Event (email)], you must add a manual Start Event temporarily to allow debug execution to be performed.
- You must remember to remove the manual Start Event once the debug execution is complete and before releasing the App.